
Schematic Generator for Faster, Easier Switching Operations


Time is a precious commodity in the control room. Minutes can be particularly critical when switching and load transfer operations are necessary.
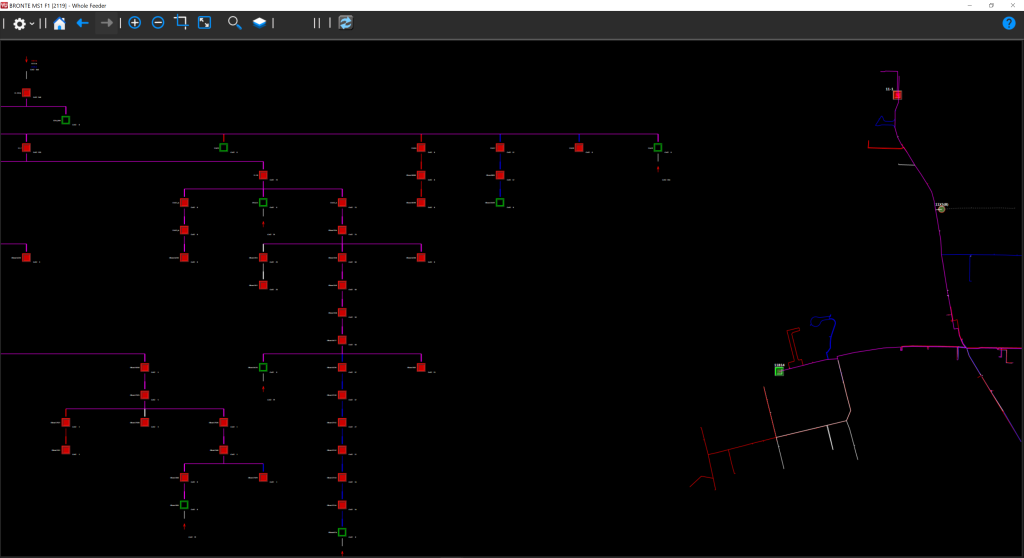
Schematic Generator is an add-on application for SmartVU that improves the ease and efficiency of switching and load transfer activities. It enables SmartVU to quickly generate a hierarchical view of a selected feeder so you can better evaluate your planned switching and load transfer options. Using the schematic diagram, you can immediately understand all the interconnected elements and devices in the feeder circuit, determine what is upstream and downstream of any device, choose the optimal reconfiguration, and perform switching and load transfer operations directly from this view.
Rather than replacing the geographic view in SmartVU, Schematic Generator works in conjunction with it, so you can choose the view that best suits your needs at any given moment.
The Schematic Generator displays a snapshot of the as-operated, real-time status of a line section at the time it is generated.
How does it work?
With Schematic Generator, you can quickly toggle between schematic and geographic views. Right-clicking on any line section in your distribution network enables you to display a schematic diagram of the feeder that includes all relevant telemetered and non-telemetered devices and alarm conditions, as well as values of telemetered devices, and the number of downstream customers.
- The interactive, hierarchical view delivers key information for rapid decision-making and switching and load transfer operations (particularly helpful during outages!)
- You can perform any activity in the schematic diagram that you would do in the geographic map, including data entry, supervisory control, device tagging, activation/ deactivation, alarm function management, and more
- Users can configure to display any of the measurement values at the telemetered device or the number of customers downstream of the device to be displayed next to the device in the schematic view
- The application is easy to set up and use—configure your settings once and all schematic diagrams will automatically adopt the same settings
Why do you need a schematic view?
Performing switching operations and load transfers using only a geographic view or paper maps can be inefficient. With a schematic view, you can quickly identify all the interconnected devices, examine the variables, and take action. Here are some sample use cases:
- Let’s say you have to isolate between two load breakers. In order to do this, you would normally pan along the geographic map to find both load breakers, potentially using multiple screens to do so. With the Schematic Generator, locating the breakers and performing the actions is much simpler—plus it can all be done on one screen.
- In the case of a feeder outage, you can quickly pull up the schematic of the feeder to understand the extent of the outage. You can also generate schematics for backup feeders to view their status prior to performing load transfers.
- Many utilities consult paper maps for planned work. With Schematic Generator, all the information you need is readily available on your screen including real-time values.
Interested in learning more about the Schematic Generator? Read our brochure or click here to have a team member reach out to you.
Frequently Asked Questions (FAQs)
What is the Schematic Generator in SurvalentONE and why is it needed?
The Schematic Generator is an add-on for SmartVU that instantly creates a hierarchical, schematic view of any selected feeder. It enables operators to quickly identify upstream and downstream devices, evaluate switching options, and execute switching or load transfers more efficiently than with traditional geographic views or paper maps.
How do operators access and use the schematic diagrams?
Operators can right-click on a line section in SmartVU to open a schematic diagram of the feeder. The interactive diagram displays both telemetered and non-telemetered devices, alarm conditions, real-time measurement values, and the count of downstream customers. Operations like supervisory control, tagging, and activation/deactivation can be performed directly within this view.
Can operators switch between schematic and geographic views?
Yes. The schematic view works alongside the geographic map. Operators can toggle between the two depending on which view best supports their workflow or situational needs.
What key information does the schematic diagram display for decision-making?
The schematic shows real-time analog values for telemetered devices (e.g., measurements or DSE calculations), alarm states, number of downstream customers, and device interconnections—helping operators plan and execute switching and load transfers with confidence.
How does Schematic Generator improve efficiency during switching operations?
Unlike geographic or paper-based maps, the schematic view consolidates complex information into a single interactive screen. It helps operators locate critical devices quickly, understand circuit topology, evaluate outage extent, and perform switching or load transfers all in one streamlined, intuitive interface.